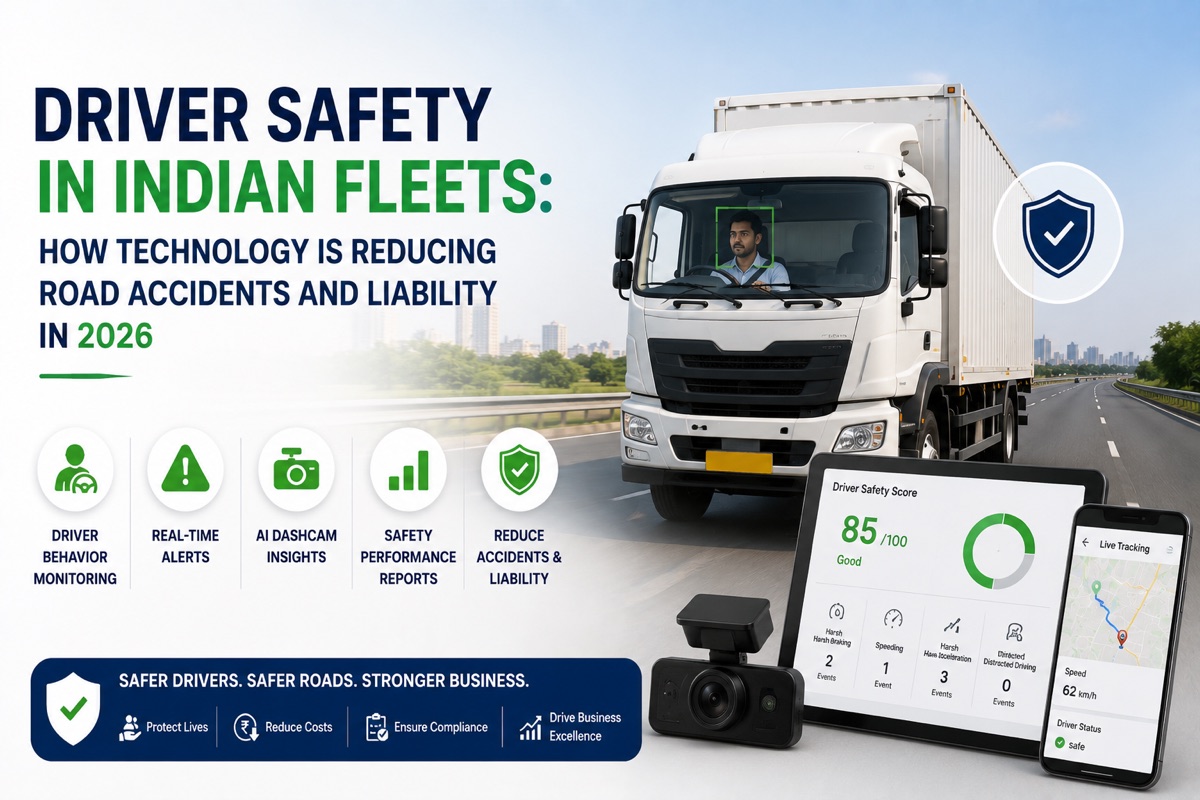
India has among the highest road accident rates in the world. For fleet operators, every accident involving their vehicle creates financial exposure that extends well beyond the repair cost — cargo loss, third-party liability, insurance premium increases, driver downtime, and potential criminal proceedings under the Motor Vehicles Act.
The Business Cost of a Fleet Accident
When a commercial vehicle is involved in a serious road accident, the direct costs are only the beginning:
- Vehicle repair: Rs 50,000-5,00,000+ depending on damage severity
- Cargo damage or loss: Full consignment value if goods are uninsured or claim is disputed
- Third-party liability: Under the Motor Vehicles Act, unlimited liability for bodily injury or death
- Driver downtime and replacement: 2-4 weeks of operational disruption per serious incident
- Insurance premium increase: A single at-fault accident can increase fleet premiums 15-30% at renewal
- Legal proceedings: Criminal investigation possible in cases of death or serious injury
For a 50-vehicle fleet experiencing 4-6 significant accidents per year — not unusual for unmonitored operations — the total annual cost of road incidents commonly exceeds Rs 20-40 lakh.
The most effective way to reduce this cost is not better claims management. It is preventing the accidents from happening.
The Five Driver Behaviours That Cause Most Fleet Accidents
Telematics data across large fleet populations consistently identifies five behaviours as the primary drivers of road incidents:
1. Speeding: The single most significant risk factor. Accident severity increases exponentially with speed. A vehicle travelling 20% above the speed limit has dramatically higher stopping distance and collision energy.
2. Harsh braking: A symptom of following too closely or inattention. Drivers with high harsh braking frequency are statistically at much higher accident risk than those who brake progressively.
3. Fatigue-related driving: Long-haul drivers who exceed practical driving hour limits show degraded reaction times and decision-making — visible in GPS data as inconsistent speed, late braking, and lane deviation patterns.
4. Mobile phone use while driving: Increasingly monitored through AI camera systems — a distraction that multiplies accident risk significantly.
5. Aggressive acceleration: Correlates with aggressive driving style generally and increases fuel consumption alongside safety risk.
How Fleetcodes Builds a Data-Driven Safety Culture
Per-Driver Safety Scoring
Fleetcodes tracks each driver's safety behaviour continuously — speeding events, harsh braking frequency, harsh acceleration, and extended idle time. These metrics combine into a per-driver safety score that is visible to both the driver in the app and to the fleet manager in the dashboard.
The score is not punitive — it is coaching material. When a driver can see their own safety score, the specific events that affected it, and how they compare to the fleet average, behaviour changes. The most effective safety improvements in fleet operations come not from enforcement but from transparent data that makes the driver's own performance visible to them.
Proactive Alerts Before Problems Escalate
Fleetcodes generates real-time alerts when safety threshold events occur:
- Vehicle exceeding configured speed limit for the route
- Harsh braking event during a trip
- Unusual stop pattern suggesting driver fatigue
These alerts reach the dispatcher or operations manager immediately — enabling a call to the driver before a pattern becomes an incident.
Night-Driving and Fatigue Management
For long-haul fleets, Fleetcodes tracks cumulative driving time per driver and flags when drivers are approaching hours-of-service limits. Route planning can be configured to build in mandatory rest stops on long-haul assignments — reducing the operational pressure that leads drivers to push beyond safe driving windows.
Safety as an Insurance Lever
As detailed in our fleet insurance negotiation guide, driver safety data from Fleetcodes directly supports lower insurance premiums. Insurers offering telematics-linked pricing use behaviour data to offer 8-15% premium discounts for fleets with demonstrably safe behaviour records.
The safety investment pays back twice: fewer accidents (direct cost reduction) and lower premiums (ongoing cost reduction).
Building a Safety Culture Beyond Technology
Technology surfaces data. Culture determines what happens with it.
Management commitment: Safety metrics reviewed weekly, not monthly. When management treats safety data as a priority operational metric alongside utilisation and profitability, the organisation follows.
Driver recognition: Publicly recognising drivers with strong safety scores — through a monthly safety bonus or simple acknowledgement — creates positive reinforcement that enforcement alone cannot generate.
Training on specific data: When coaching a driver on their safety record, specificity matters. "Your harsh braking frequency was 3x the fleet average on Tuesday's run on the Delhi-Agra stretch" is actionable. "Please drive more carefully" is not.
FAQs
What are the most common causes of commercial vehicle accidents in India? Speeding, driver fatigue, harsh braking from following too closely, and mobile phone use while driving. Telematics data consistently identifies these five behaviours as the primary risk factors in fleet accident causation.
How does Fleetcodes help reduce fleet accidents? Fleetcodes tracks per-driver safety behaviour — speeding events, harsh braking, harsh acceleration — and generates a safety score per driver. Real-time alerts notify dispatchers when threshold events occur. Management dashboards surface safety trends before they become incident patterns.
Can driver safety data reduce insurance premiums? Yes. Indian insurers offering telematics-linked pricing use driver behaviour data to offer 8-15% premium discounts for fleets with documented safe driving records. Fleetcodes generates the standardised safety data reports these programmes require.
Every accident that does not happen saves money, protects your drivers, and builds the safety record that reduces your insurance cost. See How Fleetcodes Monitors Driver Safety Across Your Fleet →