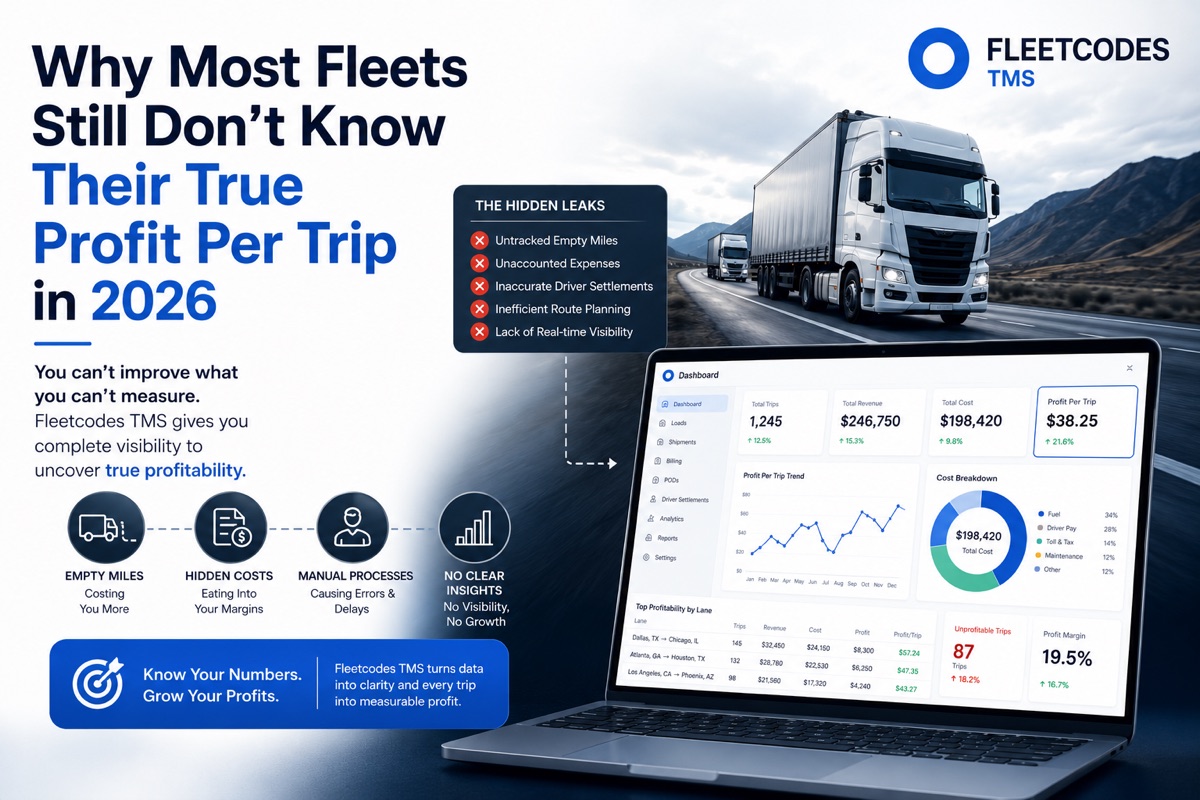
You know your total revenue. You know your rough costs. But do you know which routes make money and which ones quietly lose it? Most fleet operators don't — and that's exactly why margins stay thin.
The Profitability Blind Spot in Indian Logistics
Here's a scenario that plays out across hundreds of logistics businesses in India every month:
The business looks healthy on a high level. Revenue is growing. Trucks are moving. The owner or MD reviews the monthly P&L and sees an overall profit — nothing alarming.
But dig one level deeper and the picture changes. One lane is delivering strong margins. Another lane — maybe a high-volume, long-distance route — is barely breaking even when you factor in fuel variability, toll costs, driver overtime, and the time the truck spends waiting at the loading dock.
The problem? Most fleet operators have no system that measures profit at the load level. They're managing the business on aggregate numbers, which means loss-making routes get hidden inside overall revenue — and they never get fixed.
This is one of the most common and costly gaps in fleet management operations across India. And it's one that modern transport management system software is specifically designed to close.
See how Fleetcodes gives you profit visibility per load → Book a Demo
Why Measuring Profit Per Load Is So Hard Without the Right Tools
If profit-per-load visibility is so valuable, why don't more fleet operators have it? The honest answer is that it's genuinely difficult to calculate manually — because the costs involved are variable, multi-source, and often captured in different systems (or not captured at all).
To know the true profit on a single load, you need to account for:
Revenue side:
- Freight rate charged to the customer (which may vary by load weight, route, and contract terms)
- Any surcharges applied — fuel adjustment, detention, overweight
Cost side:
- Fuel consumed on the specific trip (not an average — the actual litres burned)
- Toll charges paid on the route
- Driver wages and overtime for that trip
- Vehicle maintenance and tyre cost per kilometre
- Loading/unloading time costs
- Any accessorial charges or delays
Assembling this data manually — from fuel logs, toll receipts, driver time sheets, maintenance records, and billing sheets — takes significant time and is almost always incomplete. The result is that most fleet mgmt teams give up and manage by approximation.
Fleetcodes aggregates all of this data automatically — per trip, per vehicle, per route, and per customer.
The Four Profitability Questions Every Fleet Operator Should Be Able to Answer
If you can't answer these questions today, your business is running blind:
1. Which routes are genuinely profitable?
Not based on revenue alone — based on net margin after all variable costs. Some routes look great on paper but are eroded by long waiting times, high toll costs, or fuel inefficiency on the specific vehicle assigned.
2. Which customers are your most profitable?
A customer giving you high volume at low rates may actually be less profitable than a smaller customer on better terms — especially if the high-volume customer's routes have high variable costs or frequent delays.
3. Which vehicles have the highest cost-per-kilometre?
Older vehicles with higher maintenance costs and poorer fuel efficiency may be making certain loads unprofitable. Without fleet management software tracking cost-per-km by vehicle, these hidden drains go unnoticed.
4. How is driver behaviour affecting load profitability?
Excessive idling, inefficient routes, speeding that increases fuel burn — driver behaviour directly affects the cost side of every load. Real-time tracking combined with trip cost analysis makes this visible.
How Fleetcodes Builds Profit-Per-Load Visibility
Fleetcodes is designed to give logistics operations exactly this level of financial visibility — connecting the revenue data in your billing system with the cost data from your operations.
Here's how each module contributes:
Billing & Rate Card Engine Every load's revenue is automatically captured based on the customer's rate card — including any surcharges. No manual reconciliation needed.
Fuel & Toll Integration Trip-level fuel consumption is tracked via the connected driver app and GPS data. Toll costs are captured at the point of payment. Both are assigned to the specific load — not averaged across the fleet.
Vehicle Cost Profiles Fleetcodes allows you to build a cost profile for every vehicle in your fleet — factoring in depreciation, maintenance schedules, and insurance — and allocates a per-km cost to every trip.
Driver Productivity Tracking Driver wages, overtime, and allowances are tracked per trip, giving you the full labour cost of every load alongside the vehicle and fuel costs.
Load-Level P&L Dashboard All of the above flows into a fleet management shipping profitability dashboard that shows you margin per load, per route, per customer, and per vehicle — updated in real time as trips are completed.
What Happens When You Have This Visibility
The strategic value of knowing your profit per load isn't just about finding bad routes and fixing them. It changes how you run the entire business:
Rate negotiations become data-driven. When you know exactly what a route costs, you know exactly what rate you need to be profitable — and you can defend that position with customers.
Fleet allocation improves. You can assign your most fuel-efficient vehicles to your highest-volume, lowest-margin routes — improving profitability without changing the rate.
Poor-performing contracts don't renew silently. Without load-level data, underperforming customer contracts often renew by default. With Fleetcodes, you see the problem before renewal and either renegotiate or redirect capacity.
Operational efficiency becomes a competitive advantage. When your team is managing logistics with this level of cost visibility, you can quote more competitively than operators running blind — and still make better margins.
This is how fleet management india private limited operations that have adopted integrated transport management system software are outcompeting their peers on margin, not just on volume.
The Difference Between Reporting and Insight
Most fleet operators have some reporting. They have monthly fuel bills. They have invoicing records. They may have GPS data.
What they lack is synthesis — a system that brings all of this together and presents it as actionable insight at the load level.
Transport management system software like Fleetcodes isn't a reporting tool that organises data you already have. It's an intelligence layer that connects your operational, financial, and logistics data — and surfaces the specific insights that drive better decisions and better margins.
Without it, you're managing a complex, cost-intensive operation based on aggregates and gut feel. With it, you're managing every load with the same financial rigour a well-run business applies to every other decision.
FAQs
What is profit per load in fleet management? Profit per load is the net margin earned on a single freight trip — calculated by subtracting all variable costs (fuel, tolls, driver wages, vehicle cost per km) from the freight revenue earned. It's the most granular measure of fleet profitability.
Why can't fleet operators calculate this with spreadsheets? The data required is spread across multiple systems and captured in different formats — GPS, fuel logs, billing records, toll receipts, driver time sheets. Assembling it manually per trip is too time-consuming to be operationally viable, so most operators don't do it.
How does Fleetcodes capture fuel costs at the trip level? Fleetcodes integrates with GPS and driver app data to track actual distance and route per trip, combined with vehicle fuel efficiency profiles and fuel purchase records from the driver app, to calculate trip-level fuel cost.
Can I see profitability by customer in Fleetcodes? Yes. Fleetcodes' profitability dashboard allows you to view load-level, route-level, and customer-level margin — giving you a complete picture of which relationships are driving profit and which are not.
How does profit-per-load visibility help with cost saving? When you can see exactly which routes, vehicles, and customers are eroding margin, you can make targeted improvements — renegotiating rates, reassigning vehicles, or optimising routes — rather than applying blanket cost cuts that may reduce operational efficiency.
Know exactly what every load earns. Manage every route for profit. That's Fleetcodes. Book Your Free Demo →