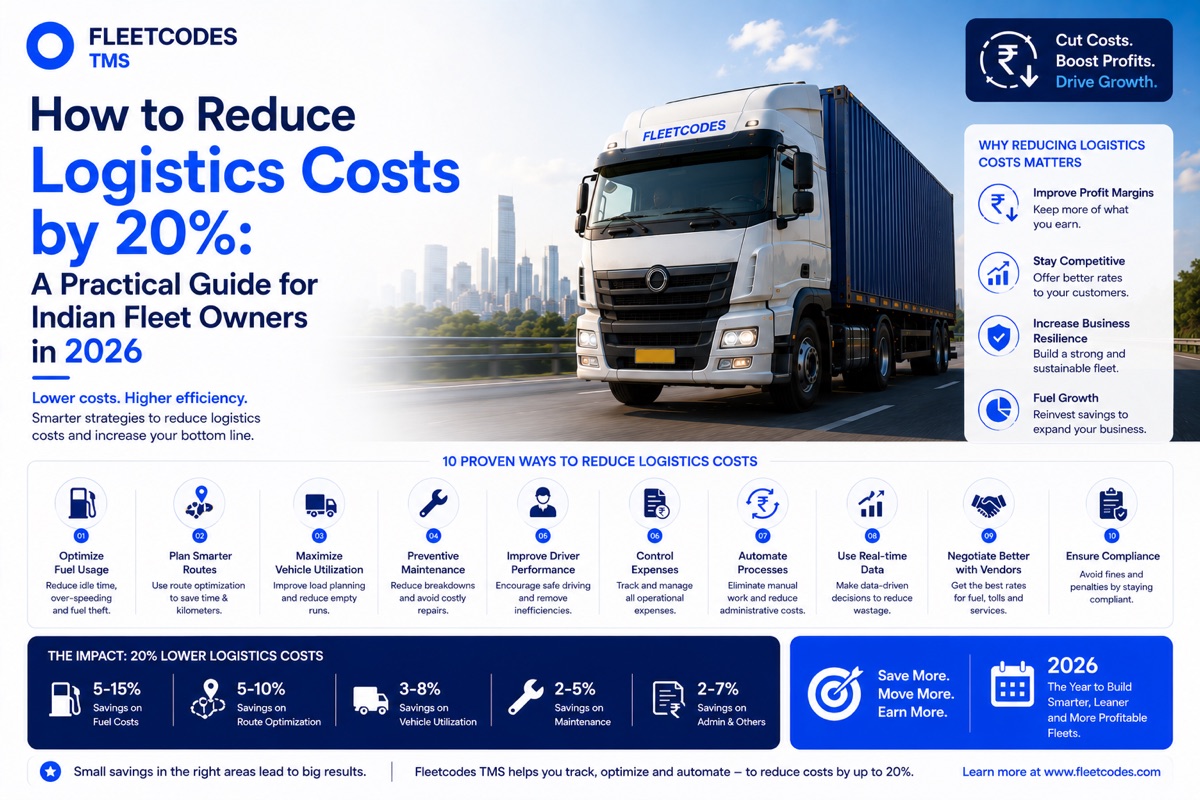
A 20% reduction in logistics costs sounds ambitious. For most Indian fleet operators running on manual systems, it is not — because most are carrying 20–30% in avoidable cost that they cannot see, measure, or act on. Visibility is the first step. Action is the second.
Why 20% Is a Realistic Target — Not a Stretch Goal
When logistics business owners hear "reduce logistics costs India by 20%," the instinctive reaction is scepticism. The business is already lean. Margins are thin. Every obvious cost has been looked at.
What this guide addresses is the category of costs that are not obvious — because they are not measured. You cannot cut a cost you cannot see. And in manually managed fleet operations, a significant proportion of operating costs are genuinely invisible: they accumulate across dozens of small operational decisions made every day, and they never appear as a line item in the monthly P&L.
The seven cost categories in this guide collectively represent 20–35% of typical operating costs for an Indian fleet running on manual operations. Addressing all seven systematically — with the right data and the right tools — is how logistics cost reduction strategies produce results that feel like they should have been achieved years ago.
Cost Lever 1: Fuel — Your Biggest Controllable Expense
Fuel represents 35–40% of total operating costs for most Indian logistics fleets. It is also the cost with the most untapped reduction potential in manual operations, for one simple reason: without per-vehicle, per-trip fuel tracking, you have no idea which drivers, routes, or vehicles are inefficient — and you cannot fix what you cannot measure.
What the data typically shows:
- A 15–25% variance in fuel consumption between the best and worst-performing drivers on the same route and vehicle type
- 10–15% of total trip distance in avoidable route deviation — detours not attributable to traffic or road conditions
- 8–12% of daily fuel consumption in unnecessary idling — engine running while parked at customer docks, rest stops, and depots
How to fix it:
- Track fuel consumption per vehicle and per driver against a baseline for each route
- Flag deviations — when consumption rises more than 10% above baseline, investigate before it compounds
- Monitor idling time per vehicle and set acceptable thresholds with driver accountability
- Optimise routes using actual traffic and cost data, not dispatcher experience alone
Fleetcodes tracks per-vehicle fuel consumption continuously, flags anomalies automatically, and surfaces driver behaviour metrics that directly correlate with fuel cost. Most fleets see 8–12% fuel cost reduction within the first 90 days of systematic monitoring.
Estimated saving on a ₹1 crore/month fleet: ₹2.8–4.8 lakh per month from fuel efficiency alone.
Cost Lever 2: Empty Miles — Revenue You Are Paying For
Every kilometre your truck runs without a paying load is a kilometre you pay for — fuel, driver wages, vehicle wear — and earn nothing from. Most Indian logistics fleets run 25–35% of total kilometres empty.
What this costs: On a 50-vehicle fleet averaging 400 km per vehicle per day, a 30% deadhead rate means 6,000 km of empty running daily. At ₹8 per km total operating cost, that is ₹48,000 per day — ₹1.44 crore per month — in completely unproductive movement.
How to fix it:
- Track empty-to-loaded km ratio per vehicle, per route, and per lane — you cannot reduce it if you do not measure it
- Build return load matching into the dispatch workflow — when a vehicle finishes a delivery, the dispatcher is immediately prompted to find a return load before the truck heads back empty
- Plan trips as round-trips where possible, not single-direction assignments
- Identify systematic deadhead lanes and either develop return load partnerships or reprice those lanes to account for the empty leg cost
Fleetcodes surfaces empty mile percentage in real time and prompts dispatchers when vehicles are completing deliveries without return loads assigned. Fleet cost management India through deadhead reduction typically delivers 30–40% improvement in empty mile percentage within the first two months.
Estimated saving: Reducing deadhead from 30% to 18% on a 50-vehicle fleet saves approximately ₹38,000–50,000 per day.
Cost Lever 3: Billing Leakage — Revenue Already Earned but Not Collected
As covered in depth in our guide on revenue leakage in logistics, billing gaps in manual operations cost Indian fleets 3–8% of freight revenue every month. The sources: unbilled detention time, stale rate cards, missing surcharges, lost PODs, multi-stop billing errors, and carrier overcharges.
How to fix it:
- Automate invoice generation — triggered by digital POD confirmation, not by a billing team member remembering to raise it
- Store customer rate cards centrally in your TMS and apply them automatically to every invoice
- Use geofence arrival/departure data to track detention automatically and bill it consistently
- Validate carrier invoices against agreed rates and actual trip data before payment
Estimated saving on ₹1 crore/month revenue: ₹3–8 lakh per month in recovered billing.
Cost Lever 4: Reactive Maintenance — Paying 3–4x Too Much
A vehicle that breaks down on a highway does not just cost the repair. It costs the daily revenue earning potential of that vehicle, the emergency roadside recovery, the cost of sourcing parts urgently, the driver's standby time, and in some cases a customer relationship. Preventive maintenance on schedule costs 3–4x less than the equivalent reactive repair.
What typically goes wrong in manual operations:
- Service intervals tracked by a physical register that nobody checks consistently
- Maintenance scheduled based on time (monthly service) rather than actual km — vehicles that run more get over-serviced or under-serviced
- Early warning signs — unusual fuel consumption, GPS-flagged idle patterns, driver-reported noises — go unrecorded and unacted on until a breakdown confirms them
How to fix it:
- Track service intervals per vehicle by actual km, not by calendar
- Build maintenance alerts into your dispatch system — vehicles due for service should be flagged before they are assigned to long-haul routes
- Log every service action digitally, with parts, cost, and next-due date
- Monitor fuel consumption as a leading indicator of mechanical issues — a consumption spike often precedes a breakdown by days or weeks
Fleetcodes tracks maintenance schedules per vehicle against actual km data, alerts the operations team before service is due, and automatically removes vehicles from dispatch availability when scheduled maintenance is confirmed.
Estimated saving: Reducing breakdown frequency by 60% across a 50-vehicle fleet typically recovers ₹1–3 lakh per month in emergency repair premium and lost vehicle operating days.
Cost Lever 5: Driver Costs — Settlement, Attrition, and Behaviour
Driver costs are the second-largest expense category in any fleet, and also one of the most complex to optimise without data. Three distinct sub-categories each offer meaningful savings:
Settlement disputes and processing cost: Manual settlement calculation takes 4–6 hours per month per 50 drivers, is prone to errors that create disputes, and delays payments in ways that damage driver satisfaction and increase attrition. Automated settlement eliminates the processing time and dramatically reduces disputes.
Driver attrition and replacement cost: As detailed in our driver retention guide, replacing a driver costs ₹50,000–1,00,000 in recruitment, onboarding, and lost productivity. At 25% annual attrition across a 50-vehicle fleet — 12–13 replacements per year — that is ₹6–13 lakh annually in preventable cost. Transparent settlement, app-based tools, and performance recognition each contribute to retention.
Driver behaviour fuel impact: The 15–25% fuel consumption variance between drivers is the most direct driver-cost-to-fuel-cost link. Coaching specific underperforming drivers with their own data — not general instructions — consistently produces measurable behaviour change within weeks.
How to fix it: Automate settlement, deploy a driver app that reduces paperwork friction, and use per-driver fuel analytics to coach specific behaviour changes.
Estimated combined saving across settlement, attrition, and behaviour: ₹2–5 lakh per month for a 50-vehicle fleet.
Cost Lever 6: Administrative Overhead — Hours Spent on Tasks Software Should Do
Manual fleet management is administration-intensive in ways that are easy to underestimate. Consider a typical day in a mid-size fleet without TMS automation:
- Dispatcher spends 3–4 hours coordinating loads manually by phone, spreadsheet, and WhatsApp
- Billing team spends 5–6 hours per 100 trips on invoice generation, POD chasing, and rate card lookup
- Accounts staff spends 4–6 hours per month per 50 drivers on settlement calculation and dispute resolution
- Operations manager spends 8–12 hours assembling the monthly performance report from multiple disconnected data sources
This is 20–25 hours per day of staff time on work that transport cost optimization software automates. At a blended staff cost of ₹200–300 per hour, that is ₹1.2–1.8 lakh per month in administrative cost that disappears when operations are automated.
More importantly — it is 20–25 hours per day that your team could spend on customer relationships, operational improvement, and business development instead.
Cost Lever 7: Poor Asset Utilisation — Vehicles That Do Not Pull Their Weight
Every vehicle in your fleet represents a capital investment and a fixed operating cost. A vehicle that runs only 15 days per month, consistently deadheads, or is assigned to routes where its size or fuel efficiency creates unnecessary cost is delivering poor return on that investment.
How to fix it:
- Track utilisation per vehicle — km operated, load ratio, revenue generated, cost incurred
- Identify systematic underperformers — vehicles whose cost-per-km is significantly above the fleet average
- Make allocation decisions based on data — which vehicle type performs best on which route type, which vehicles should be prioritised for high-revenue lanes
- Use utilisation data to inform fleet composition decisions — when to replace, when to acquire, what specification to prioritise
Estimated saving: Improving fleet utilisation from 65% to 80% across 50 vehicles is equivalent to adding 7–8 productive vehicle-days per month without capital investment.
The Compound Effect: How the Levers Add Up
| Cost Lever | Conservative Monthly Saving (50 vehicles, ₹1Cr/month revenue) | |---|---| | Fuel efficiency (10% improvement) | ₹2.8–3.5 lakh | | Empty mile reduction (30% to 18%) | ₹3.0–4.0 lakh | | Billing leakage recovery (5%) | ₹5.0 lakh | | Preventive vs reactive maintenance | ₹1.0–2.0 lakh | | Driver costs (attrition + behaviour) | ₹2.0–4.0 lakh | | Administrative overhead elimination | ₹1.2–1.8 lakh | | Asset utilisation improvement | ₹1.5–2.5 lakh | | Total | ₹16.5–22.8 lakh/month |
Against ₹1 crore per month in revenue, this range represents 16.5–22.8% cost reduction — arriving at that 20% target not through one dramatic intervention, but through seven measurable improvements running simultaneously.
FAQs
What are the most effective ways to reduce logistics costs in India? The highest-impact interventions are: fuel consumption monitoring and driver behaviour coaching (8–12% fuel saving), empty mile reduction through dispatch optimisation (30–40% deadhead reduction), and billing leakage recovery through automated invoice generation (3–8% of revenue recovered). Together these three typically account for the majority of achievable cost reduction.
How does fleet management software help cut transport costs? Fleet management software provides the measurement, automation, and visibility that manual operations lack. It tracks fuel per driver and vehicle, surfaces empty mile opportunities, automates billing to close leakage gaps, manages maintenance schedules preventively, and eliminates administrative overhead — addressing all seven cost levers simultaneously.
How long does it take to see cost savings after implementing a TMS? Most Fleetcodes customers identify measurable billing leakage recovery and empty mile reduction within the first month. Fuel efficiency improvements from driver behaviour coaching typically show within 30–60 days of monitoring. Full compound savings across all seven levers are usually visible within 90 days.
Is a 20% logistics cost reduction realistic for small fleets? Yes — and the ROI is often stronger for smaller fleets, because the fixed cost of manual administration represents a higher proportion of revenue. A 20-vehicle fleet carrying the same administrative overhead as a 50-vehicle fleet has proportionally more to gain from automation.
What is the first cost lever to address? Start with billing leakage — it is the fastest to see results from (same-day invoice generation is visible immediately) and recovers revenue that has already been earned. Then address fuel monitoring and empty miles, which require 30–60 days of data collection before coaching and optimisation produce measurable results.
Twenty percent is not a round number chosen for marketing appeal. It is what the data shows when you measure seven specific cost leaks and close them systematically. The question is not whether the saving is there. It is whether your operation has the visibility to find it. Book a Free Fleetcodes Demo — Get a Cost Analysis for Your Fleet →