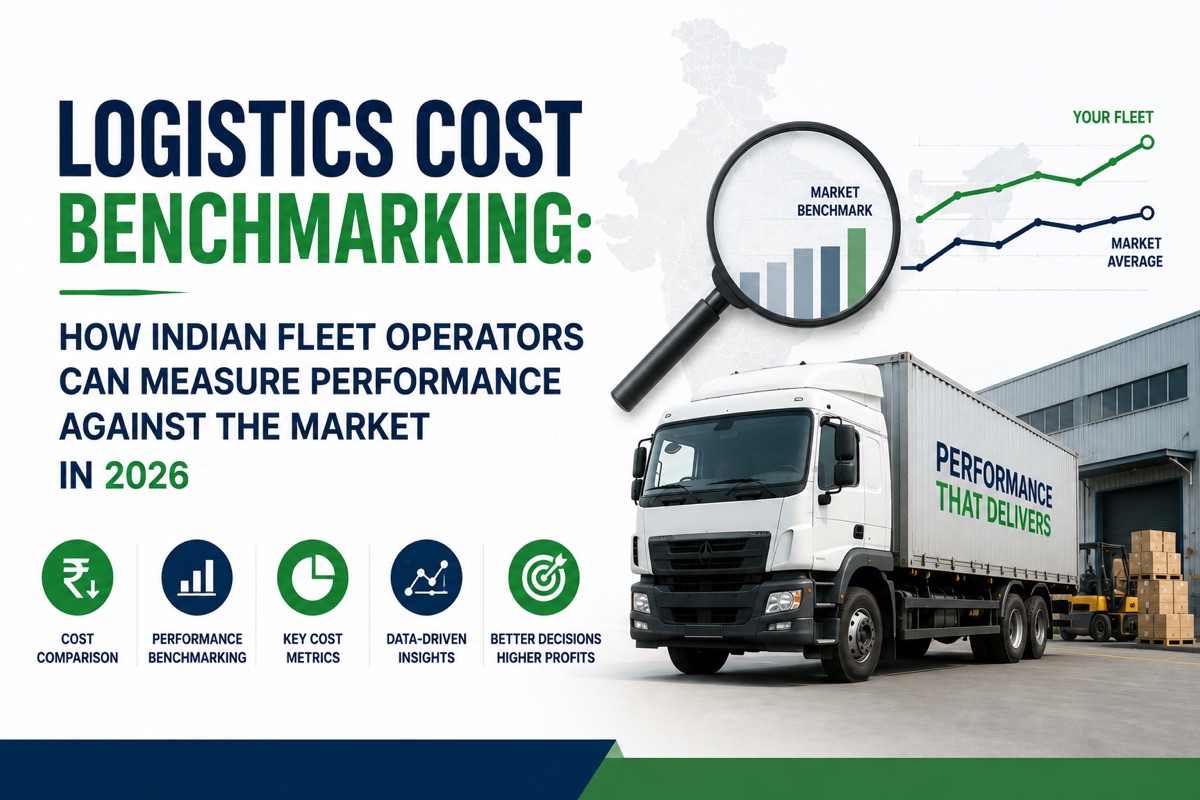
The most dangerous number in fleet management is not a high cost. It is a cost you think is normal but is not. Benchmarking tells you whether your Rs 28/km is competitive or whether your competitors are running at Rs 22/km and you just do not know it yet.
Why Most Fleet Operators Do Not Benchmark
Benchmarking requires two things most manually managed fleets lack: their own accurate cost data, and a reliable source of industry comparison data.
When you do not know your actual cost per km — because fuel, driver wages, tolls, and maintenance are tracked in separate records or not tracked at all — you cannot compare it to anything meaningful.
Fleetcodes generates your cost data automatically: per-vehicle, per-trip, per-route, in real time. Once you have this data, benchmarking becomes straightforward.
The Key Benchmarks for Indian Fleet Operations in 2026
1. Cost Per Kilometre
Industry benchmark range (HGV, national highway): Rs 22-32/km total operating cost
What the range reflects: Fuel (Rs 8-12/km), driver wages (Rs 4-6/km), maintenance (Rs 2-4/km), tyre amortisation (Rs 1.5-3/km), overhead allocation (Rs 3-6/km)
What puts you above the range:
- Fuel consumption above vehicle class baseline
- High maintenance cost from reactive (not preventive) maintenance
- High driver attrition creating replacement costs
- Significant empty mile percentage inflating cost per revenue km
Target: Know your actual cost per km from Fleetcodes. If it is more than 15% above the range for your vehicle category, there is an identifiable cost issue worth investigating.
2. Fleet Utilisation Rate
Industry benchmark: 80-88% for well-managed Indian commercial fleets
What below-benchmark looks like: Vehicles sitting idle due to driver shortages, maintenance downtime, or load planning gaps
Target: Every percentage point of utilisation below 80% represents revenue-earning days being lost. On a Rs 5,000/day revenue vehicle, dropping from 85% to 75% utilisation costs Rs 50,000 in lost annual revenue per vehicle.
3. Fuel Efficiency vs Vehicle Class Baseline
Benchmark: Within 8% of manufacturer-rated consumption for the vehicle class on your route type
What above-benchmark looks like: Fuel consumption 15-25% above baseline is common in unmonitored fleets — typically attributable to driver behaviour (excessive idling, aggressive acceleration), maintenance issues (injectors, filters, tyre pressure), or route inefficiency
Target: Identify any vehicle running more than 10% above its Fleetcodes-established baseline and investigate before the month ends.
4. Empty Mile (Deadhead) Percentage
Industry benchmark: 12-18% for efficiently managed Indian road freight operations
What above-benchmark looks like: 25-35% deadhead rate is common in unoptimised fleets — representing fuel spend, driver wages, and vehicle wear generating zero revenue
Target: Track your deadhead rate weekly in Fleetcodes. Every 5% reduction in deadhead on a 50-vehicle fleet saves approximately Rs 8-15 lakh annually.
5. On-Time Delivery Rate
Industry benchmark: 88-94% for professional Indian road freight operations
What below-benchmark looks like: Chronic lateness driven by route planning failures, vehicle reliability issues, or driver performance — leading to customer complaints, SLA penalties, and contract loss
Target: Track OTDR per customer account in Fleetcodes. If any customer account is below 85%, the root cause is almost always identifiable through the GPS trip data.
6. Billing Cycle Time
Industry benchmark: 0-2 days for digitally enabled operations; 3-7 days for manual operations
What the gap costs: Each day of billing delay represents additional working capital tied up in receivables. On Rs 1 crore monthly revenue with 30-day payment terms, a 5-day billing cycle adds Rs 16.7 lakh to your working capital requirement compared to same-day billing.
How to Use Benchmarks Practically
Step 1 — Establish your baseline: Pull your actual metrics from Fleetcodes for the last 3 months. Cost per km, utilisation, fuel efficiency, deadhead percentage, OTDR, billing cycle time.
Step 2 — Identify gaps: Which metrics are above the benchmark range? By how much?
Step 3 — Prioritise by financial impact: Calculate the annual cost of each gap. Which one closed first would have the biggest impact?
Step 4 — Set improvement targets: Specific, measurable, time-bound. "Reduce deadhead from 28% to 20% within 90 days by implementing return load prompting in dispatch."
Step 5 — Review monthly: Benchmarks are not a one-time exercise. Monthly review of KPI performance against targets creates the operational discipline that compounds over time.
FAQs
What is a good cost per km for HGV operations in India in 2026? Rs 22-32/km total operating cost is the competitive range for HGV national highway operations. Below Rs 22/km typically indicates under-maintained vehicles or under-compensated drivers. Above Rs 32/km indicates addressable inefficiency in fuel, maintenance, or overhead.
Where can I find Indian logistics cost benchmark data? Industry benchmarks come from AITWA publications, logistics industry reports (KPMG, Deloitte India logistics studies), and fleet management platform aggregated data. Fleetcodes customers can compare their metrics against anonymised fleet cohort benchmarks within the platform.
How does Fleetcodes make benchmarking practical? Fleetcodes generates all the metrics above automatically — cost per km, utilisation rate, fuel consumption per vehicle, deadhead percentage, OTDR, and billing cycle time. No manual data compilation required. The dashboard displays current performance and trends, making benchmarking a real-time operational tool rather than a quarterly exercise.
Benchmarking is not about comparing yourself to a number. It is about identifying exactly where your fleet is losing money that your competitors are not losing. See Your Fleet's Performance Against Industry Benchmarks — Book a Demo →