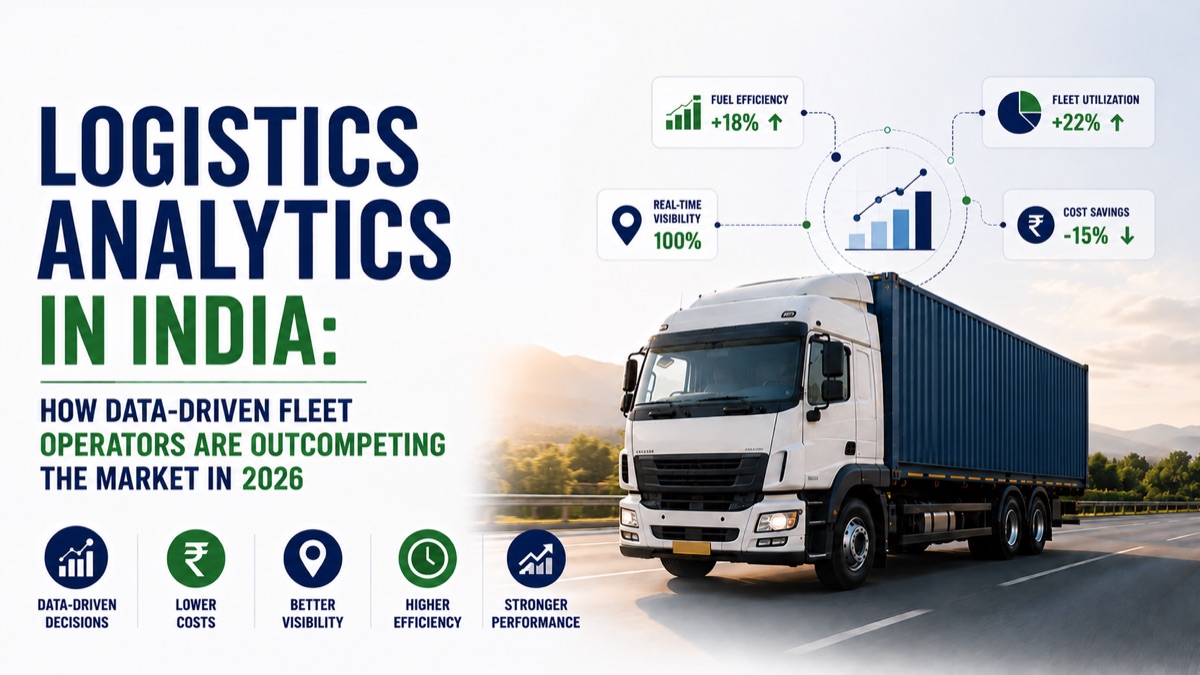
Two fleet operators. Same number of trucks. Same routes. Same customers. One reviews a monthly P&L assembled from memory and spreadsheets. The other reviews a live dashboard showing margin per customer, cost anomalies per vehicle, and driver performance by route. In twelve months, their margins are not the same.
What Logistics Analytics Actually Means for an Indian Fleet Business
Logistics analytics in the Indian context is not big data projects or machine learning models. It is the ability to answer the operational and financial questions that determine whether a fleet business is profitable or not:
- What is my actual cost per km, per vehicle, per route — not estimated, but GPS-verified?
- Which of my customers are genuinely profitable and which are consuming capacity at below-viable margins?
- Which drivers are performing efficiently and which are costing me money through fuel overconsumption or delivery failure rates?
- Where are my empty miles concentrated and what is the revenue I am losing to deadhead?
- Is my billing leakage measurable — and how much am I losing to uninvoiced detention, stale rates, or missed surcharges?
When these questions can be answered from a connected platform — in real time, without manual report assembly — they change how a business is managed. Decisions that previously waited for month-end data happen in the week or the day when they can still make a difference.
Fleetcodes is the analytics platform Indian fleet operators use to answer all of these questions — not from a separate reporting tool, but from the operational data the platform captures as a byproduct of running every trip.
The Four Analytics Layers That Matter Most
1. Cost Analytics: Knowing What Each Trip Actually Costs
The foundation of fleet analytics is cost visibility at the trip level — the actual, verified cost of each freight movement, not the fleet average.
Fleetcodes combines four cost sources per trip automatically:
Fuel cost: GPS-verified distance multiplied by the vehicle's established fuel efficiency profile, cross-referenced against FASTag and driver app fuel entries. Not an estimate — an actual per-trip fuel cost.
Toll cost: FASTag transaction data allocated automatically to the trip in progress at the time of each toll transaction. Multi-state routes with multiple toll crossings are allocated accurately, not approximated.
Driver cost: Settlement calculation for the trip — base rate, per-km component, overnight allowances — derived from trip data and the driver's pay structure.
Vehicle overhead: Depreciation per km, maintenance cost per km, and insurance allocation — derived from the vehicle's cost profile stored in Fleetcodes.
The result: a total cost figure for every completed trip, assembled automatically, visible in the management dashboard without any manual compilation.
When you know your cost per trip, you know your margin per trip. When you know your margin per trip across hundreds of trips, you know which routes, customers, and vehicle types are driving your profitability — and which are eroding it.
2. Customer Analytics: Which Relationships Are Actually Profitable
This is where Fleetcodes analytics consistently surfaces surprises for fleet operators who have not previously had per-customer margin data.
The top-volume customer is frequently not the most profitable customer. A shipper giving 40% of your monthly freight volume may also be your worst-margined account — because the lanes are difficult, the rate card is outdated, the delivery requirements are complex, or the detention at their loading facilities is unclaimed.
Fleetcodes aggregates revenue and cost per customer account — building a profitability picture by customer that is updated with every completed trip. The management dashboard shows:
- Revenue per customer account
- Average margin per trip by customer
- On-time delivery rate by customer
- Billing dispute rate by customer
- Detention hours accumulated vs billed by customer
This data serves two purposes: it informs commercial decisions (which accounts to grow, which to renegotiate, which to walk away from), and it provides the evidence base for rate negotiation conversations — as detailed in our freight rate negotiation guide.
3. Fleet Utilisation Analytics: Identifying Idle Capacity
Fleet utilisation analytics in Fleetcodes shows the proportion of available vehicle-days being used for revenue-generating operations — per vehicle, per vehicle category, and fleet-wide.
This analysis surfaces patterns that manual monitoring misses:
Day-of-week utilisation variation: If Saturday utilisation consistently drops to 55% while Monday-Friday averages 85%, there may be an untapped weekend freight market on your key lanes worth pursuing.
Vehicle category performance gaps: If your 20-tonne fleet runs at 88% utilisation while your 10-tonne fleet runs at 62%, the smaller vehicles may be over-specified or poorly deployed for current load requirements.
Individual vehicle performance outliers: A specific vehicle running at 45% utilisation when the fleet average is 82% either has a driver availability problem, a maintenance issue keeping it off the road, or a commercial issue meaning loads are being preferentially assigned away from it.
Each of these insights requires the same data — GPS-verified operating days per vehicle — assembled and displayed in a way that makes the pattern visible. Fleetcodes does this automatically.
4. Driver Performance Analytics: The Human Cost Variable
Driver behaviour accounts for 15-25% of variance in operating cost across a fleet. The same vehicle, on the same route, with different drivers, produces measurably different fuel consumption, delivery performance, and vehicle wear outcomes.
Fleetcodes tracks per-driver performance metrics continuously:
Fuel efficiency by driver: Actual km per litre (or per kg for CNG vehicles) per driver, normalised for vehicle type and route conditions. A driver consistently 12% below the fleet average for comparable routes is adding real cost.
On-time delivery rate by driver: Which drivers consistently deliver within window and which consistently arrive late — and whether the lateness is correlated with specific routes, customers, or time periods.
Safety score by driver: Speeding events, harsh braking frequency, and harsh acceleration — per driver, per week, trended over time.
Delivery exception rate by driver: Refused deliveries, partial deliveries, and POD exceptions per driver — identifying whether specific drivers have patterns that need coaching.
The analytics value of this data is not surveillance. It is the ability to have specific, evidence-based coaching conversations — and to recognise and reward high performers with data that proves their contribution.
From Analytics to Action: What Changes When You Have the Data
The practical value of logistics analytics is not the dashboards themselves. It is the decisions they enable that would not have happened otherwise.
Rate renegotiation triggered by data: The Fleetcodes profitability dashboard shows that Customer X's account has been margin-negative for three months. The rate conversation happens now — not when the relationship deteriorates further.
Fleet reallocation based on utilisation data: Saturday utilisation is consistently low on the western routes. A freight exchange listing search for weekend loads on those lanes reveals available freight. A new commercial arrangement fills the gap.
Driver reassignment based on performance data: Driver A consistently delivers 8% better fuel efficiency than fleet average on the long-haul routes. Driver B is consistently better on multi-stop city distribution. Reassigning each to their highest-performance route type improves fleet-wide fuel efficiency without any additional cost.
Maintenance investment justified by cost data: Vehicle Y's maintenance cost per km has been climbing for 8 weeks. The analytics make the case for a major service investment — or a replacement decision — before the vehicle becomes a net cost to the fleet.
Each of these decisions was possible before analytics — in theory. In practice, they only happen consistently when the data is automatically generated, continuously updated, and displayed in a way that makes the decision obvious.
FAQs
What is logistics analytics for Indian fleet operators? Logistics analytics is the use of operational data — trip records, GPS data, billing, fuel, and driver performance — to answer the financial and operational questions that determine fleet profitability. In Fleetcodes, this data is generated automatically from normal operations and displayed in real-time dashboards without manual report assembly.
How does Fleetcodes generate analytics without manual data entry? Every operational event in Fleetcodes creates a data point automatically: GPS records km and route, driver app records status and POD, FASTag integration records tolls, billing module records revenue and rate application. Analytics are assembled from these automatically generated records.
Which analytics dimension delivers the fastest ROI for Indian fleet operators? Customer profitability analytics typically delivers the fastest ROI — because it immediately surfaces margin-negative accounts that are consuming capacity without adequate return. Most fleet operators who see this data for the first time find at least one customer relationship that needs immediate rate renegotiation.
The fleets outcompeting the market in 2026 are not running harder. They are running with better information. Fleetcodes provides that information — automatically, from the operational data your fleet already generates every day. See Fleetcodes Logistics Analytics in Action — Book a Demo →