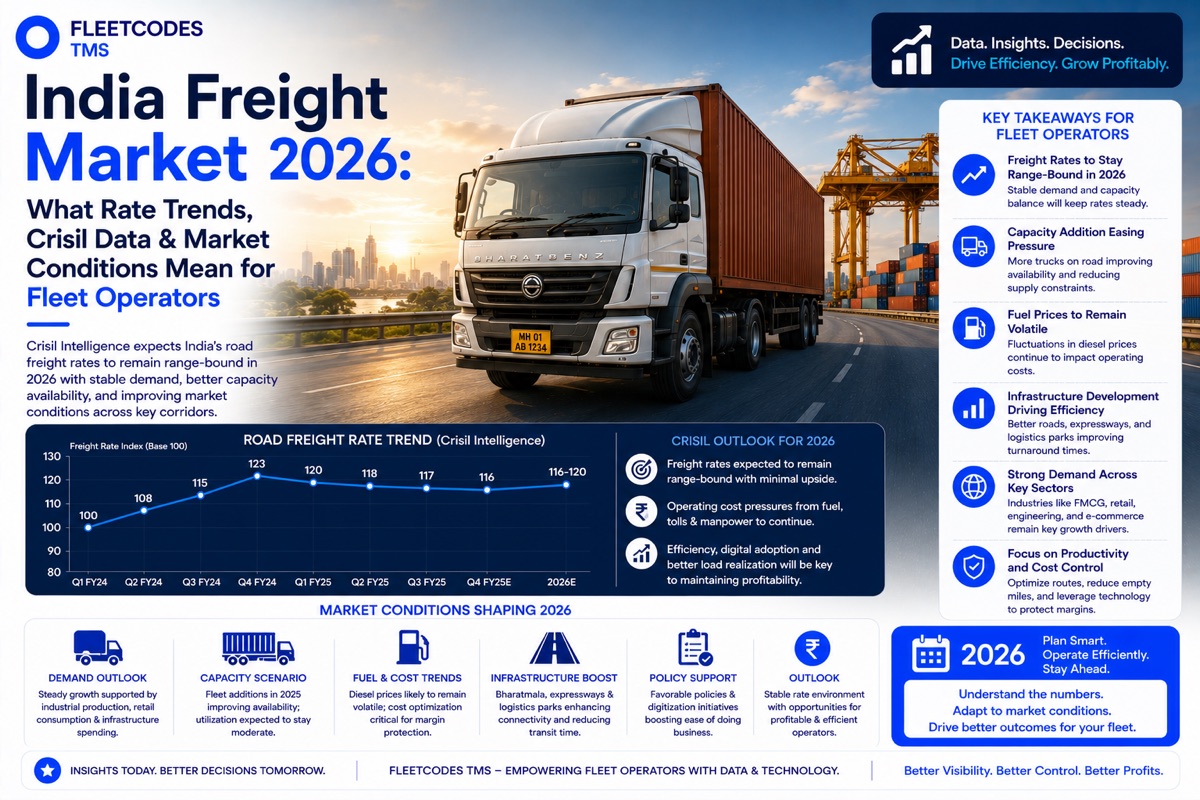
The Crisil Freight Index slipped further in April 2026, continuing a softening trend that began in February after the post-festive demand correction. Fleet oversupply, moderated industrial activity, and geopolitical disruptions to global trade flows are compressing road freight rates across major Indian corridors. For fleet operators, this is the market environment they must plan and operate within.
What the Crisil Data Is Telling the Market
The Crisil Freight Index — India's most closely watched benchmark for road freight rate conditions — has been signalling a gradually weakening market through the first half of 2026.
The pattern: freight activity improved through the third quarter of FY2026 (October–December 2025), supported by festive season demand, manufacturing activity, and the rollout of GST 2.0. FASTag transaction volumes — a real-time proxy for freight movement — rose during this period.
From February 2026, the picture changed. Key findings from the most recent data:
- FASTag transaction volumes declined sharply in March as industrial and manufacturing activity moderated after year-end dispatch momentum
- Fleet utilisation fell from the peaks of the festive and year-end period, with utilisation levels tracking below earlier peak periods across key freight routes
- Freight rates softened on major industrial corridors as cargo availability reduced while vehicle availability remained elevated
- Geopolitical factors — specifically the continuing West Asia conflict — have disrupted global trade sentiment and affected industrial supply chains that feed India's domestic freight demand
The current market is characterised by: more trucks available than loads to fill them on key corridors, shippers with improved negotiating leverage, and rate pressure that is squeezing margins for operators who were already running thin.
Understanding the Supply-Demand Dynamic in Indian Road Freight
The India freight market is structurally fragmented — India's road freight sector is still majority-unorganised, with millions of small owner-operators and fragmented fleets competing on individual lanes. This fragmentation has two important market implications:
Supply responds slowly to demand signals. When freight demand surges, new truck purchases are ordered. But vehicle delivery lead times, financing processing, and driver recruitment mean that supply additions lag the demand signal by 6–18 months. By the time the new capacity arrives, the demand cycle may have already peaked.
Rates fall faster than they rise. With many small operators competing independently — without coordinated commercial strategy — price competition in a soft market is aggressive. When loads are scarce, operators accept below-cost rates to keep vehicles moving and cover fuel and driver fixed costs. This rate destruction in weak markets is a structural feature of the fragmented sector.
For organised, technology-enabled fleet operators, this cycle creates both challenge and opportunity:
The challenge: Rate softness in Q1 2026 is compressing margins for operators who did not lock in fixed-rate contracts before the market weakened.
The opportunity: The operators who emerge from a soft market with intact customer relationships, maintained operational efficiency, and documented service quality are best positioned when freight demand recovers — because they have not destroyed their pricing by racing to the bottom.
How Fleet Operators Should Respond to a Soft Freight Market
A softening freight market is not managed the same way as a strong one. Here are the five strategic levers that protect margins and position for recovery:
Lever 1: Focus on Cost Per Km, Not Just Rate Per Km
When market rates are under pressure, the only sustainable margin protection is cost reduction. A fleet operator who cuts their cost per km by 8% while accepting a 5% rate reduction still improves margins — while a competitor who resists the rate reduction but fails to address their own cost structure loses business without improving profitability.
The cost categories with the most addressable reduction in a soft market:
- Fuel: Per-vehicle consumption monitoring typically surfaces 8–12% of addressable fuel waste. In a market where rate revenue per km is falling, fuel efficiency matters more per km than ever.
- Empty miles: In a soft market, loads are harder to find. Systematic return load matching — using real-time fleet position data to identify return opportunities — is more operationally important in a weak market than a strong one.
- Maintenance: Continuing preventive maintenance programs in a soft market is counterintuitive but correct. Deferring maintenance to preserve short-term cash flow produces breakdown costs later that are significantly more expensive.
Fleetcodes surfaces all three of these cost categories in real time — giving fleet operators the visibility to manage cost per km actively rather than discovering cost creep in the monthly P&L.
Lever 2: Protect Your Best Customer Relationships
In a soft market, the temptation is to chase every available load at any rate. The operators who manage soft markets well resist this — and instead prioritise defending the customer relationships that provide reliable volume, pay on time, and will remember who served them well when demand recovers.
Identifying your most valuable customers requires data: which customers generate the most volume, which pay the best rates, which have the best payment track records, and which have the highest service quality requirements that distinguish your operation from the commodity market. Fleetcodes' customer-level profitability data makes this analysis straightforward.
For your best customers, a soft market is an opportunity to deepen the relationship — by improving service visibility, accelerating billing cycles, and demonstrating the operational reliability that justifies why their business should stay with you even if a competitor undercuts your rate.
Lever 3: Use Downtime Productively
Reduced load volumes in a soft market mean some vehicles will have more idle time than normal. This downtime has a cost — but it also has a productive use:
- Scheduled maintenance that was deferred during busy periods can be caught up without operational disruption
- Driver training — on the Fleetcodes driver app, on fuel efficiency techniques, on compliance procedures — can be conducted without pulling drivers off active loads
- Data review: soft market periods are the best time to analyse route profitability, identify underperforming lanes, and make commercial decisions about rate renegotiation or load type changes that are harder to prioritise during peak periods
Lever 4: Lock In Fixed Contracts for Recovery Period
If the market is currently soft but the structural drivers of freight demand (infrastructure investment, e-commerce growth, manufacturing expansion) remain intact, operators who lock in medium-term contracts at current rates are positioning for rate recovery while providing customers the price certainty they want in an uncertain environment.
Approaching key customers with a 12-month fixed-rate proposal — at a modest discount to current spot rates in exchange for volume commitment — is a soft-market commercial strategy that provides both parties with value. The customer gets pricing certainty; the operator gets volume visibility.
Lever 5: Differentiate on Service Quality
In a commodity market competing primarily on rate, service quality differentiation provides a non-rate reason for shippers to choose you and stay with you. The specific service quality dimensions that matter most to shippers in 2026:
- Real-time shipment visibility — the ability to see where their freight is without calling your operations team
- Billing accuracy and speed — invoices that are correct the first time and issued promptly
- Digital POD — proof of delivery that is available immediately and can be accessed without phone calls
- Compliance reliability — no checkpoint delays, no document violations, no regulatory issues that create liability for the shipper
Each of these is enabled by the operational technology platform — and each is a service quality gap that many competitors, operating manually, cannot close.
What the Freight Market Data Suggests About the Recovery Outlook
The current softness in India's freight market is cyclical, not structural. The underlying demand drivers — infrastructure-led manufacturing growth, e-commerce expansion, organised retail's geographic expansion, and cold chain development — remain intact.
Crisil's analysis suggests recovery will be driven by: resumption of industrial activity after the post-March moderation, festive season demand in Q2 FY2027 (September–November 2026), and any resolution of geopolitical disruptions that have weighed on export-linked freight.
The operators who are best positioned for the recovery period are those who used the current soft market to:
- Reduce operating costs to a level that makes them profitable at current rates
- Protect key customer relationships through service quality rather than rate concessions
- Prepare their operations and technology foundation for the higher volumes that recovery will bring
FAQs
What is the Crisil Freight Index and what does it measure? The Crisil Freight Index is India's most closely monitored benchmark for road freight rate conditions. It tracks freight rates and volumes across major Indian corridors using FASTag transaction data, carrier surveys, and market intelligence — providing a real-time picture of supply-demand balance in the road freight market.
Why are freight rates softening in India in 2026? The current rate softness reflects a combination of: moderated industrial and manufacturing activity after the year-end dispatch peak, fleet oversupply on key corridors as vehicles added in 2025 are now available, and reduced global trade sentiment from geopolitical disruptions. Festive demand and industrial recovery are expected to support rate improvement in H2 2026.
How should fleet operators protect margins in a soft freight market? The most effective margin protection strategies in a soft market are: reducing cost per km through fuel efficiency and empty mile reduction, protecting the most valuable customer relationships through service quality rather than rate competition, and using lower-volume periods for productive maintenance and training activity.
Does fleet management software help in a soft freight market? Yes — particularly for the cost visibility and customer service quality dimensions that differentiate in a competitive market. Real-time fuel consumption tracking, empty mile visibility, same-day digital billing, and customer shipment visibility are all capabilities that fleet management platforms provide and that directly affect competitive position in a soft market.
When is the India freight market expected to recover in 2026? Recovery indicators in the H2 2026 outlook include festive season demand (September–November), manufacturing recovery after the post-March moderation, and infrastructure-linked freight from ongoing Gati Shakti project execution. The structural demand drivers remain intact — the current weakness is cyclical rather than structural.
Soft markets reveal which operations are efficient and which were relying on market tailwinds. The ones built on operational discipline come out of soft markets stronger than they went in. See How Fleetcodes Helps Protect Margins in Any Market →