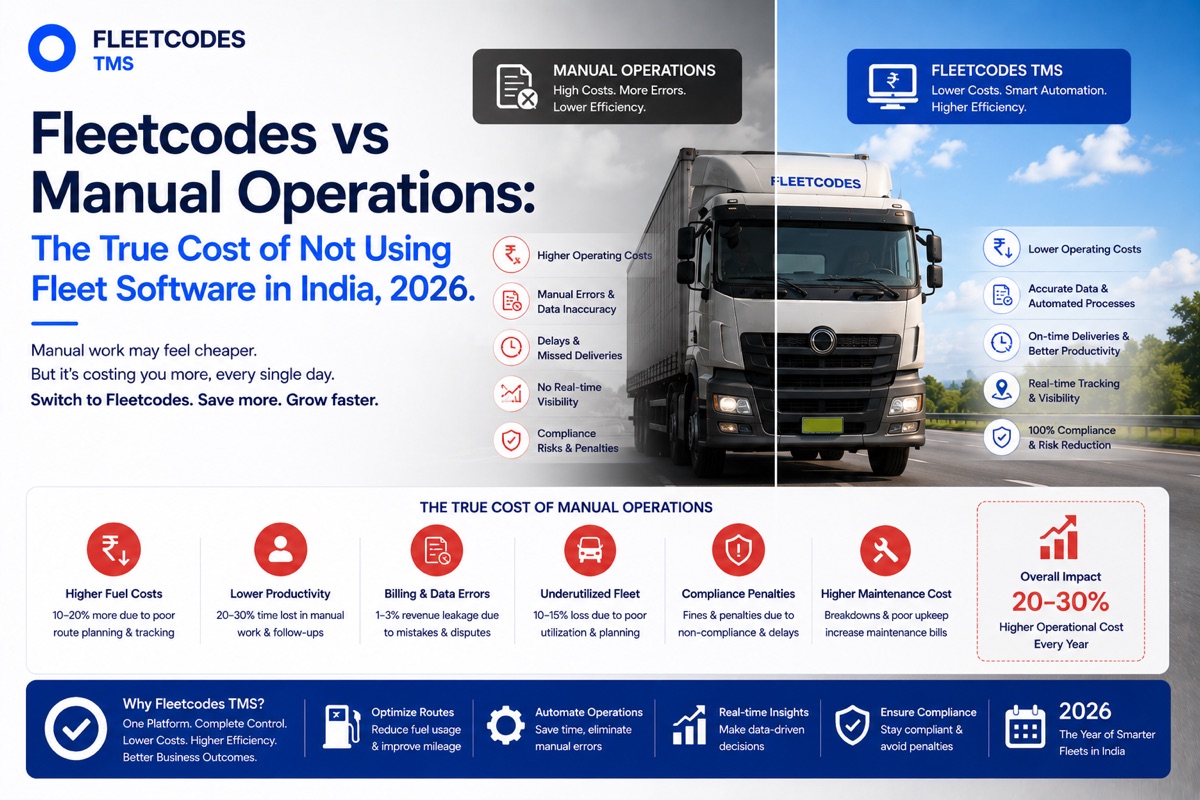
Every logistics business owner who has not yet moved to fleet management software has made a calculation — consciously or not — that the cost of the software exceeds the cost of staying manual. This article runs that calculation honestly. The result might change your mind.
The Wrong Question About Fleet Management Software Cost India
When Indian fleet operators evaluate fleet management software cost India, they typically ask the wrong question first. They look at the monthly per-vehicle subscription price, multiply by fleet size, and compare it to ₹0 for their current spreadsheet-and-WhatsApp operation.
The correct question is not "what does the software cost?" It is "what is my current operation costing me?" — in revenue leakage, in operational inefficiency, in staff time, in driver attrition, in billing errors, and in the management decisions made on incomplete information.
For most Indian logistics businesses running 20–500 vehicles on manual operations, this honest cost calculation produces a number that is significantly larger than any logistics software pricing India subscription. Often by a factor of 10 or more.
This article runs the numbers.
The Six Cost Categories of Manual Fleet Operations
Category 1: Revenue Leakage from Billing Gaps
Manual billing in logistics is structurally incomplete. Here is why:
- Detention time at customer loading docks is rarely tracked accurately without automated geofence timestamp data — so detention charges are either not raised or are disputed
- Rate card changes made in negotiation frequently do not make it into the billing template in time — invoices go out at old rates
- Surcharges (fuel adjustment, overweight, hazardous) are applied inconsistently from memory rather than from a rules engine
- Paper PODs are lost at a rate of 5–8% in most manual operations — and when the POD cannot be produced, the invoice cannot be raised
- Multi-stop trips are frequently under-billed because individual stops' charges are not fully captured
The industry benchmark for total billing leakage in manually managed operations is 3–8% of total freight revenue.
| Monthly Freight Revenue | 3% Leakage | 8% Leakage | |---|---|---| | ₹25 lakh | ₹75,000 | ₹2,00,000 | | ₹50 lakh | ₹1,50,000 | ₹4,00,000 | | ₹1 crore | ₹3,00,000 | ₹8,00,000 | | ₹2 crore | ₹6,00,000 | ₹16,00,000 |
Annual impact at ₹50 lakh/month revenue: ₹18 lakh to ₹48 lakh in uncollected billing.
Category 2: Fuel Waste from Unoptimised Routing and Driver Behaviour
Fuel typically represents 35–40% of total operating costs. In manually managed fleets, three fuel waste sources are consistently unaddressed:
Unoptimised routes: Dispatchers assigning loads from experience rather than data consistently produce routes that are 10–15% longer than necessary. At ₹8 per km average fuel cost and 10 km unnecessary distance per trip, that is ₹80 per trip. For a fleet running 500 trips per month, ₹40,000 per month in avoidable fuel expenditure.
Driver behaviour: Excessive idling, aggressive acceleration, and speeding collectively add 15–25% to per-vehicle fuel consumption relative to good driving practice. This is documented, measurable — and completely invisible in manual operations where no driver-level fuel consumption data is tracked.
Empty miles: Without systematic return load management, average deadhead percentages of 25–35% are common in Indian logistics. Each empty kilometre is a kilometre you pay for and earn nothing from.
Conservative estimate of addressable fuel waste in a manual 50-vehicle fleet: ₹3–8 lakh per month.
Category 3: Staff Time on Administrative Tasks
Manual fleet management is administration-intensive. Consider the hours your team currently spends:
| Task | Manual Time | Automated Time (Fleetcodes) | |---|---|---| | Daily dispatch coordination | 3–4 hrs/dispatcher | 45–60 min | | Invoice generation per 100 trips | 6–8 hrs/billing staff | Auto — minutes | | Driver settlement calculation | 4–6 hrs/month per 50 drivers | Auto — hours | | Management reporting (monthly) | 8–12 hrs | Auto — real time | | POD chasing and filing | 2–3 hrs/day | Zero | | Fuel log compilation | 3–4 hrs/month | Auto |
For a mid-size fleet with a dispatcher and two back-office staff, this adds up to 60–80 hours of avoidable administrative work per month. At a blended cost of ₹200–300 per hour, that is ₹12,000–24,000 per month in staff time on tasks that transport management system price India software eliminates.
More importantly — it is 60–80 hours your team is not spending on activities that actually grow the business.
Category 4: Driver Attrition and Replacement Costs
As covered in our guide on driver retention, manual operations consistently produce higher driver attrition than digitised ones — because settlement disputes, paperwork burden, and scheduling unpredictability are all products of manual workflows.
Industry average driver attrition in manually managed Indian fleets: 25–35% per year.
The cost of replacing a driver:
- Recruitment: ₹5,000–20,000 per hire
- 2–4 weeks of reduced productivity during route familiarisation
- Lost operational quality — experienced drivers know routes, customers, and freight types
- Vehicle wear from unfamiliar drivers
For a 50-vehicle fleet at 25% attrition: 12–13 replacements per year at an average total replacement cost of ₹50,000–1,00,000 = ₹6–13 lakh per year.
Category 5: Vehicle Maintenance — Reactive vs Preventive
In manual operations, maintenance happens when something breaks. The cost of reactive maintenance versus preventive maintenance is well-documented:
- Emergency roadside repairs cost 3–4x more than scheduled maintenance for the same component
- Unplanned vehicle downtime costs the vehicle's daily revenue earning potential — typically ₹3,000–8,000 per day depending on route and load type
- For a 50-vehicle fleet, if 2 vehicles average 3 breakdown days each per month: ₹18,000–48,000 per month in lost revenue
Fleet management software with preventive maintenance scheduling catches these failures before they happen. Manual operations do not.
Category 6: Management Decisions on Bad Data
This is the hardest cost to quantify — but arguably the most significant over time. When management reports are assembled manually from disconnected sources at month-end, they are always:
- Late — decisions get made 3–4 weeks after the events that prompted them
- Incomplete — cost categories that are hard to track manually simply get excluded
- Inaccurate — manual compilation introduces errors and estimates
The result: pricing decisions based on estimated costs. Route decisions based on experience rather than data. Customer retention decisions without visibility into which customers are actually profitable.
In a thin-margin industry, the compounded cost of management decisions made on bad data is substantial — even if it is impossible to put a single number on it.
The Honest Calculation
Pulling these categories together for a representative 50-vehicle fleet generating ₹1 crore per month in freight revenue:
| Cost Category | Conservative Annual Estimate | Higher Estimate | |---|---|---| | Billing leakage (5%) | ₹60,00,000 | ₹96,00,000 | | Fuel waste (routing + behaviour + deadhead) | ₹18,00,000 | ₹48,00,000 | | Staff time on administration | ₹1,44,000 | ₹2,88,000 | | Driver attrition and replacement | ₹6,00,000 | ₹13,00,000 | | Reactive maintenance premium | ₹2,16,000 | ₹5,76,000 | | Total addressable cost | ₹87,60,000 | ₹1,65,64,000 |
Against this, an annual Fleetcodes subscription for a 50-vehicle fleet represents a fraction of even the conservative estimate. The TMS ROI logistics case closes itself when the costs are laid out honestly.
What Fleetcodes Actually Replaces
To be clear about what the comparison is: Fleetcodes does not replace every tool you use. It replaces the specific manual processes that are creating the costs above.
It replaces: The dispatch spreadsheet. The paper bilty book. The manual billing template. The driver expense receipt pile. The end-of-month settlement calculation. The manually assembled management report. The separate fuel log.
It does not replace: Your customer relationships. Your operations team's judgement. Your drivers' local route knowledge. Your commercial instincts.
What Fleetcodes does is give the people running your operation the real-time data they need to make better decisions — while automating the administrative work that currently consumes their time.
The ROI Timeline
Most Fleetcodes customers achieve clear ROI within the first 90 days of deployment, through three early wins:
Month 1 — Billing leakage recovery: Automated billing catches the detention charges, rate card discrepancies, and missed surcharges that manual billing consistently misses. The first month of correct billing often recovers more than the annual subscription cost.
Month 2 — Fuel savings begin: Route optimisation and driver behaviour monitoring typically deliver 8–12% fuel cost reduction within the first two months. At ₹5–7 per km, these savings are meaningful from the very first optimised route.
Month 3 — Operational efficiency compounds: Staff freed from administrative tasks start contributing to operational improvements. Management decisions improve as real-time data replaces month-old reports.
FAQs
How much does fleet management software cost in India? Fleetcodes is priced on a per-vehicle, per-month basis — making it scalable for fleets from 15 vehicles to 500+. The exact subscription cost depends on fleet size and features required. For a personalised quote and ROI calculation based on your specific operation, book a demo with the Fleetcodes team.
What is the ROI of a transport management system for Indian fleets? For most Indian fleets transitioning from manual operations, the ROI is highly positive within 90 days — primarily driven by billing leakage recovery, fuel savings from route optimisation, and staff time savings from billing and settlement automation. Annual savings typically exceed annual software cost by a factor of 5–15x.
How does Fleetcodes compare to using spreadsheets for fleet management? Spreadsheets provide data storage without integration. They require manual data entry, do not trigger automated workflows (billing, alerts, settlement), cannot provide real-time visibility, and cannot scale without proportional increases in staff time. Fleetcodes replaces the spreadsheet with a connected system where operational events automatically update billing, settlement, and reporting.
What is the cost of manual fleet management? The total addressable cost of manual operations for a 50-vehicle fleet generating ₹1 crore per month in freight is typically ₹87 lakh to ₹1.65 crore per year — across billing leakage, fuel waste, administrative staff time, driver attrition, reactive maintenance, and management decisions made on incomplete information.
Can small fleets afford fleet management software in India? Yes. Fleetcodes is designed to deliver enterprise-grade fleet management capabilities at a price point and deployment simplicity that works for fleets from 15 vehicles upward. The ROI calculation is proportionally even more favourable for smaller fleets, where every percentage point of efficiency improvement has a more direct impact on owner income.
The question is not whether fleet management software is worth the cost. The question is whether you can afford to keep paying for what manual operations are costing you. Book a Free Fleetcodes Demo — Get Your ROI Calculated →