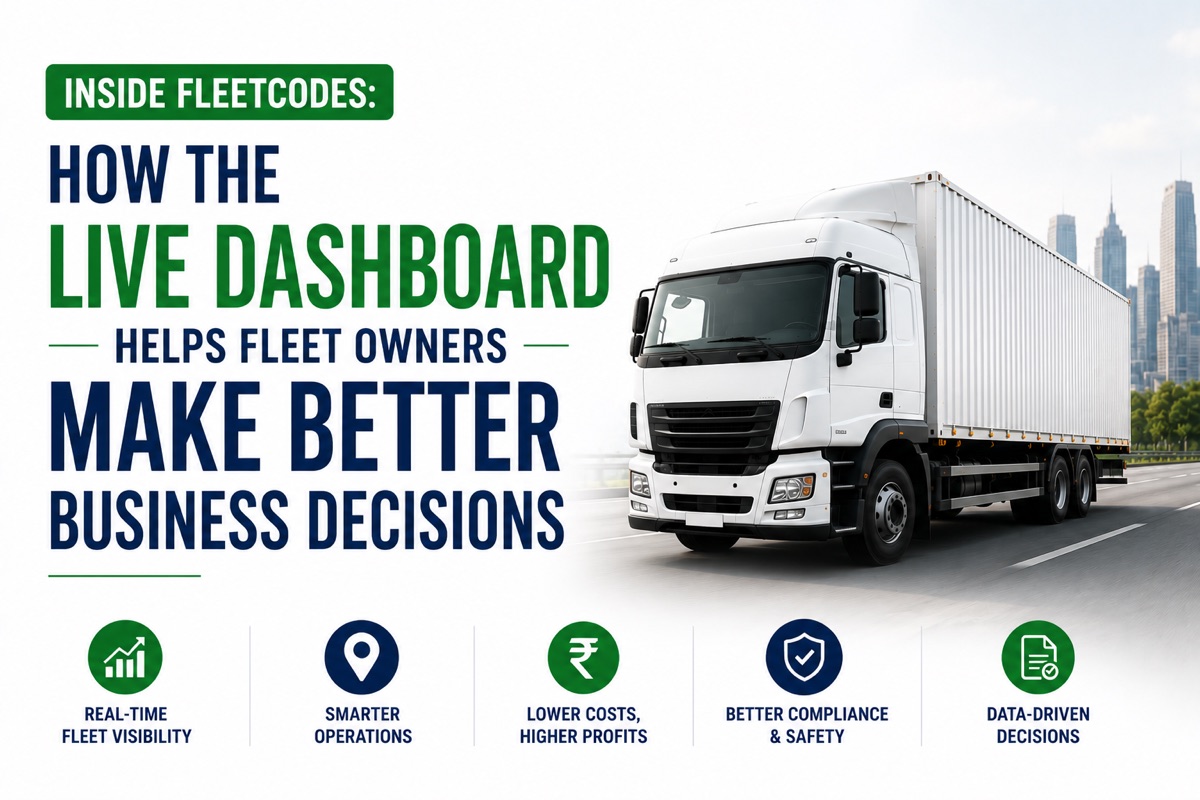
A dashboard that shows last month's performance is a history lesson. A dashboard that shows this morning's performance is a management tool. The difference is whether it changes what you do today.
The Problem with Monthly Fleet Reporting
Ask most Indian fleet owners how the business is performing right now and the honest answer is: "I will know when the accounts are done."
Monthly P&Ls assembled from fuel registers, trip sheets, and billing records tell you what happened 3-4 weeks ago. By the time a cost problem is visible in the report, it has been compounding for a month.
Fleetcodes is built so that management information is not a monthly output. It is a live picture — updated in real time as vehicles move, deliveries are confirmed, and costs are recorded.
What Each Role Sees
The Owner / MD
- Live revenue today / this week / this month — updated as invoices generate from confirmed deliveries, not when billing compiles numbers
- Profit per trip (today's average) — net of GPS-verified fuel, FASTag toll, driver settlement, and vehicle overhead
- Fleet utilisation rate — how many vehicles are active, idle, or in maintenance right now
- Top customers by margin — not by volume, but by actual profit contribution this month
- Cost anomaly alerts — any vehicle or driver significantly above cost baseline, flagged automatically
The Operations Manager
- All vehicles on map — live position — with current status: loaded, empty, at customer, in maintenance
- On-time delivery rate today — real-time OTDR from trips completed vs committed windows so far
- Active exceptions — delayed trips, route deviations, stalled vehicles — visible before the customer calls
- Driver availability — who is free for the next assignment, who is near their hours limit
The Dispatcher
- AI-suggested assignments for pending loads — with reasoning visible: nearest vehicle, best fuel efficiency on the route
- Return load opportunities — vehicles completing deliveries without a return assignment, with nearby available loads surfaced automatically
The Driver (App)
- My trips today — assignment details, stop sequence, navigation
- My safety score this week — speeding events, harsh braking vs fleet average
- My earnings this month (running total) — no waiting until pay day to know what has been earned
The Decisions the Dashboard Makes Possible
Midday load reallocation: Operations manager sees at 11 AM that three vehicles complete their morning runs in the same zone by 1 PM. Two incoming afternoon loads are assigned to those vehicles — no additional vehicle needed from depot.
Customer profitability action: MD sees Customer A is 40% of revenue but 18% of profit — because the lanes are high-cost and the rate card is overdue for renewal. The rate conversation is triggered by dashboard data, not a month-end review.
Driver coaching this week: Operations manager notices Driver X has had 7 harsh braking events this week — significantly above the fleet average. Coaching happens this week, not at the next quarterly review.
Cost spike investigation today: A vehicle's fuel consumption is flagged at 15% above its baseline. Investigated today, a tyre pressure issue is found — caught before it compounds over 3-4 weeks.
FAQs
What does the Fleetcodes live dashboard show fleet owners? Real-time revenue, profit per trip, fleet utilisation, customer-level profitability, live vehicle status, and cost anomaly alerts — all updated continuously from operational data as trips progress.
How is this different from a monthly fleet report? A monthly report shows what happened. The Fleetcodes dashboard shows what is happening — enabling decisions today that prevent tomorrow's problems.
Does it require manual data entry to stay current? No. The dashboard is populated automatically from GPS tracking, driver app updates, digital POD, invoice generation, FASTag records, and settlement data — all flowing in through normal operational use.
Management information should tell you what to do today — not what happened last month. See the Fleetcodes Live Dashboard — Book a Demo →