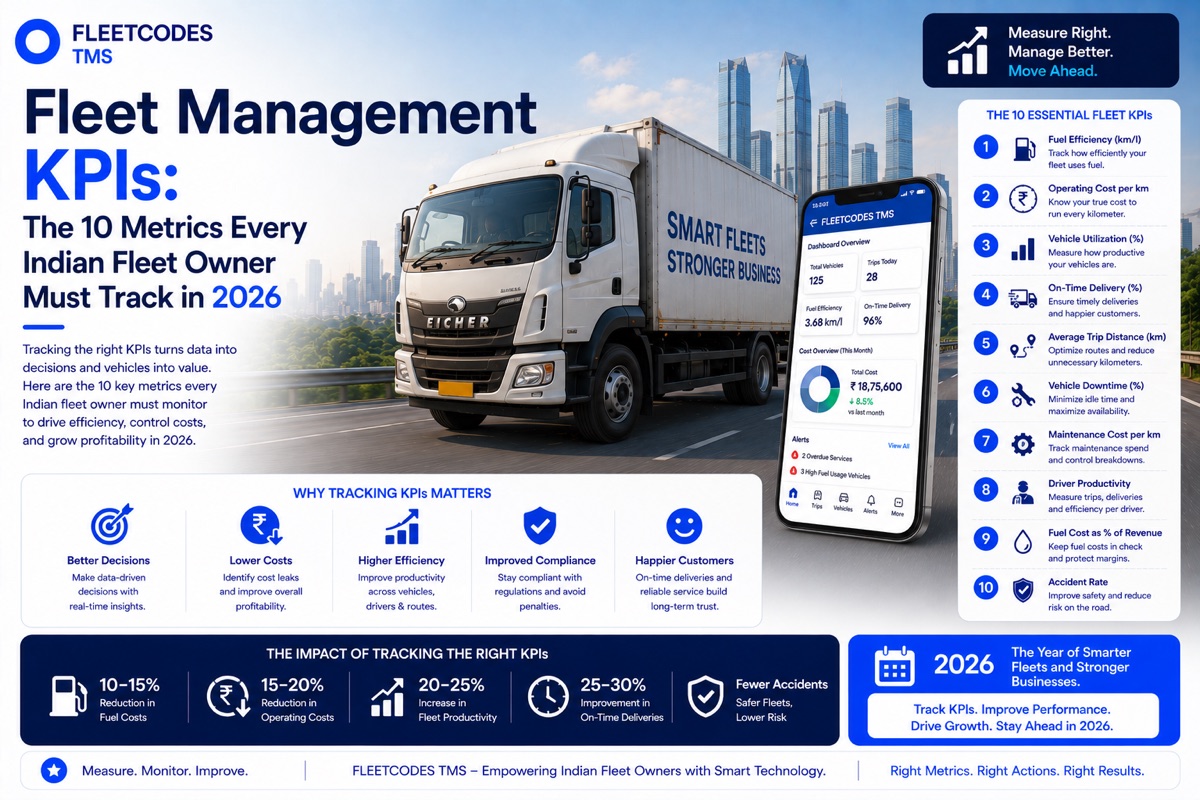
Revenue is a lagging indicator. It tells you what happened. The 10 fleet management KPIs in this guide are leading indicators — they tell you what is about to happen to your revenue, your costs, and your margins, while you still have time to act.
Why Most Fleet Owners Are Flying Blind
Ask an Indian fleet owner how their business is performing and you will typically get a revenue figure. Ask them what their fleet utilisation rate is, what their average cost per km was last month, or what their on-time delivery percentage is — and most will give you a rough estimate, a qualifier, or a frank admission that they do not track it.
This is not a criticism. Running a logistics business without structured fleet performance metrics is the norm in India — because collecting and analysing these metrics manually requires more time and effort than most operations teams have available. When your dispatcher is busy managing loads and your accounts team is chasing PODs, nobody has time to compile a KPI report.
The problem is that unmeasured operations accumulate cost invisibly. Fuel consumption drifts upward. Utilisation drops. Empty miles creep up. Delivery performance erodes. And by the time the monthly P&L shows the impact, the decisions that caused it are three weeks old.
Fleet management KPIs India tracked in real time — automatically, by a platform that generates them from operational data — are what allow fleet operators to manage by leading indicators rather than lagging ones.
Fleetcodes generates all 10 of the metrics below automatically from operational data. Every trip creates the data points. The KPI dashboard assembles them in real time.
KPI 1: Fleet Utilisation Rate
Definition: The percentage of available vehicle-days actually used for revenue-generating operations.
Formula: (Vehicle-days in operation ÷ Total available vehicle-days) × 100
What good looks like: 80–90% for a well-managed fleet with predictable demand What bad looks like: Below 65% — significant idle capacity being paid for without being used
Why it matters: A fleet that is 65% utilised is paying full fixed costs (depreciation, insurance, finance) on 35% of its vehicles without generating revenue from them. Utilisation improvement is among the highest-leverage profitability levers available — because fixed costs do not change when utilisation rises, but revenue does.
How to improve it: Better forward load planning, return load matching to fill empty legs, preventive maintenance scheduling to reduce unplanned vehicle downtime.
KPI 2: Cost Per Kilometre (Cost/km)
Definition: The total operating cost of the fleet divided by total kilometres operated in the period.
Formula: Total operating cost (fuel + maintenance + driver cost + overheads) ÷ Total km operated
What good looks like: ₹18–28/km for a well-managed HGV fleet on national highway routes (varies significantly by vehicle type and route) What bad looks like: More than 15% above your own baseline — indicates cost drift that needs investigation
Why it matters: Cost/km is the single most useful fleet cost benchmark because it normalises for volume. A month with high costs but high km may still have a healthy cost/km. A month with lower costs but far fewer km may have a concerning cost/km. It also enables lane-by-lane profitability analysis when compared to per-km revenue.
How to improve it: Fuel efficiency monitoring, preventive maintenance (lower breakdown cost per km), route optimisation (more revenue km per total km), driver behaviour coaching.
KPI 3: On-Time Delivery Rate (OTDR)
Definition: The percentage of deliveries completed within the committed delivery window.
Formula: (On-time deliveries ÷ Total deliveries) × 100
What good looks like: 95%+ for a high-performance fleet; 90%+ as a baseline standard What bad looks like: Below 85% — customer relationships and contract renewal are at risk
Why it matters: OTDR is the primary customer service metric in logistics. Customers do not remember on-time deliveries — they remember late ones. And in 2026, large shippers track OTDR as a formal supplier performance metric. Falling below agreed SLAs triggers penalties, contract reviews, or loss of business.
How to improve it: Route optimisation for realistic transit times, departure time discipline, real-time tracking with proactive exception escalation, driver performance analytics on delivery time adherence.
KPI 4: Fuel Consumption Per Vehicle (litres/100km)
Definition: The average fuel consumption per 100 km operated, tracked per vehicle.
Formula: Total litres consumed ÷ (Total km ÷ 100), calculated per vehicle
What good looks like: Within 5% of the manufacturer's rated consumption for the route and load type What bad looks like: More than 10% above vehicle baseline — indicates mechanical issue or driver behaviour problem
Why it matters: This is the most actionable fuel metric because it is per-vehicle and deviations flag specific problems. A fleet-wide fuel average masks the individual vehicle consuming 20% more than it should. Per-vehicle tracking surfaces that problem immediately.
How to improve it: Per-vehicle baseline profiling, automatic anomaly alerts, driver behaviour coaching on idling and acceleration, preventive maintenance to catch fuel-related mechanical issues early.
KPI 5: Empty Mile Percentage (Deadhead Rate)
Definition: The percentage of total kilometres operated without a paying load.
Formula: (Empty km ÷ Total km) × 100
What good looks like: Below 15% for efficiently managed fleets with good return load coverage What bad looks like: Above 30% — a significant proportion of operating cost is generating no revenue
Why it matters: As explored in detail in our empty miles guide, every empty km costs fuel, driver time, and vehicle wear with zero revenue return. On a 50-vehicle fleet, reducing deadhead from 30% to 18% saves crores annually.
How to improve it: Real-time vehicle completion visibility to dispatchers, proactive return load assignment before vehicles go empty, geofencing to flag vehicles finishing deliveries without return assignments.
KPI 6: Billing Cycle Time
Definition: The average number of days from delivery completion to invoice dispatch to the customer.
Formula: Average (Invoice date − Delivery date) across all trips in the period
What good looks like: Same day (0 days) with digital POD and automated billing What bad looks like: 5+ days — your cash flow is funding 5 days of working capital on every consignment
Why it matters: Billing cycle time directly determines cash flow. On 30-day payment terms, a 5-day billing lag means your effective payment terms are 35 days. On ₹1 crore monthly revenue with 30-day terms, each day of billing lag represents approximately ₹3.3 lakh of additional working capital requirement.
How to improve it: Digital POD with automatic invoice trigger eliminates billing cycle time entirely for standard deliveries.
KPI 7: Driver Attrition Rate
Definition: The percentage of drivers who leave the business in a given period, annualised.
Formula: (Drivers who left in period ÷ Average driver headcount) × 12/period months × 100
What good looks like: Below 10% annually — a stable, experienced driver workforce What bad looks like: Above 25% — significant operational disruption and replacement cost
Why it matters: Driver attrition carries direct cost (replacement, recruitment, training) and indirect cost (loss of route familiarity, reduced delivery quality during onboarding, customer relationship disruption). It is also a leading indicator of operational culture — high attrition consistently signals settlement disputes, poor working conditions, or inadequate tools.
How to improve it: Settlement transparency and accuracy, driver app to reduce paperwork burden, advance trip assignment visibility, performance recognition based on data. See our full driver retention guide.
KPI 8: Revenue Per Vehicle Per Day
Definition: Average daily revenue generated per available vehicle.
Formula: Total freight revenue ÷ (Number of vehicles × Operating days in period)
What good looks like: Benchmarks vary significantly by vehicle type, route, and cargo — but consistent upward trend is positive; unexplained decline warrants investigation What bad looks like: Declining trend without volume justification — indicates pricing erosion, utilisation drop, or both
Why it matters: Revenue per vehicle per day is the top-line productivity metric for a fleet. It connects revenue to the asset base generating it. When this metric falls, either fewer loads are being carried (utilisation problem) or loads are being carried at lower rates (pricing problem) — and the distinction matters for the correct response.
How to improve it: Rate negotiation supported by cost data, utilisation improvement through better dispatch planning, route mix optimisation toward higher-value lanes.
KPI 9: Maintenance Cost Per Vehicle Per Month
Definition: Average monthly maintenance expenditure per vehicle, tracked individually.
Formula: Total maintenance spend ÷ Number of vehicles in period (tracked per vehicle for anomaly detection)
What good looks like: Declining or stable per-vehicle maintenance cost as preventive maintenance programs mature What bad looks like: Significantly above-average individual vehicles — these are candidates for accelerated retirement or major maintenance intervention
Why it matters: Maintenance cost per vehicle identifies the outliers in your fleet — the vehicles whose maintenance cost has reached a level where replacement is more economical than continued operation. Without per-vehicle tracking, fleet composition decisions are based on intuition rather than data.
How to improve it: Preventive maintenance scheduling by actual km (not calendar), per-vehicle maintenance cost tracking, lifecycle cost analysis to inform replacement timing.
KPI 10: Profit Per Trip (Load-Level Margin)
Definition: Net margin per individual trip, calculated as freight revenue minus all direct trip costs.
Formula: Trip freight revenue − (Fuel cost + Toll cost + Driver cost per trip + Vehicle cost per km allocation)
What good looks like: Positive on every trip; target margin varies by fleet and lane type — typically 8–15% for well-managed road freight What bad looks like: Negative or near-zero on specific lanes, routes, or customers — these require immediate rate or cost review
Why it matters: This is the most granular and most valuable financial metric in fleet management — because aggregate profitability can hide systematic margin destruction on specific lanes. As covered in our profit per trip guide, many fleet operators discover loss-making routes embedded inside overall positive performance. You cannot fix what you cannot see.
How to improve it: Per-trip cost visibility from integrated TMS, lane-level profitability analysis to identify underperforming routes, rate renegotiation supported by cost data.
Building Your KPI Dashboard: The Practical Path
Most fleet operators who have read this far are thinking one of two things:
"I already know some of these — I just don't track them systematically." The solution is a connected TMS that generates them automatically from operational data rather than requiring manual compilation.
"I don't track any of these — I wouldn't know where to start." The solution is the same. Start with a platform that captures the operational data (GPS, digital POD, billing, settlement) and generates the metrics as a byproduct of normal operations.
Fleet dashboard analytics in Fleetcodes displays all 10 of these KPIs in real time — updated as trips are completed, invoices are raised, and driver settlements are processed. No report to compile. No spreadsheet to maintain. The metrics exist because the operations are running through the system.
The transition from tracking nothing to tracking everything does not require a measurement project. It requires a connected operational platform where the measurement happens automatically.
FAQs
What are the most important fleet management KPIs for Indian fleets? The highest-impact KPIs for Indian fleet operations are: fleet utilisation rate (how much of your capacity is earning), cost per km (your operational efficiency benchmark), on-time delivery rate (your customer service metric), fuel consumption per vehicle (your most granular cost signal), and profit per trip (your bottom-line reality check per route).
How do you calculate fleet utilisation rate? Fleet utilisation rate = (Vehicle-days in operation ÷ Total available vehicle-days) × 100. A fleet of 50 vehicles with 40 operating on any given day has 80% daily utilisation. Monthly utilisation accounts for maintenance days, driver availability, and seasonal demand variation.
What is a good on-time delivery rate for Indian logistics? A good on-time delivery rate for road freight operations in India is 90–95% or above. Below 85% signals operational problems — route planning issues, vehicle reliability problems, or driver performance concerns — that are likely already affecting customer relationships.
How does Fleetcodes calculate profit per trip automatically? Fleetcodes combines freight revenue from billing records with GPS-verified fuel consumption, FASTag toll records, driver settlement data, and vehicle cost-per-km allocations to generate a profit-per-trip figure for every completed journey. This requires no manual data assembly — it is a byproduct of running operations through the connected system.
Can small fleets with 10–20 vehicles benefit from KPI tracking? Yes — and the impact is often proportionally greater for small fleets. When a 10-vehicle fleet has one vehicle running consistently above fuel baseline, that single vehicle may be costing ₹20,000+ per month in excess fuel. Per-vehicle KPI tracking identifies this immediately; manual operations absorb it silently.
You cannot manage what you cannot measure. The 10 KPIs above are your measurement framework. A connected TMS is how you measure them without adding an analyst to your team. Book a Free Fleetcodes Demo — See All 10 KPIs on a Live Dashboard →